Space Science · The Solar System
Solar System: Planet Distances & Model Limits
Analyze average Sun–planet distance data, build a distance-only scale model, and explain what solar-system diagrams cannot show accurately.
Read the science notes ↓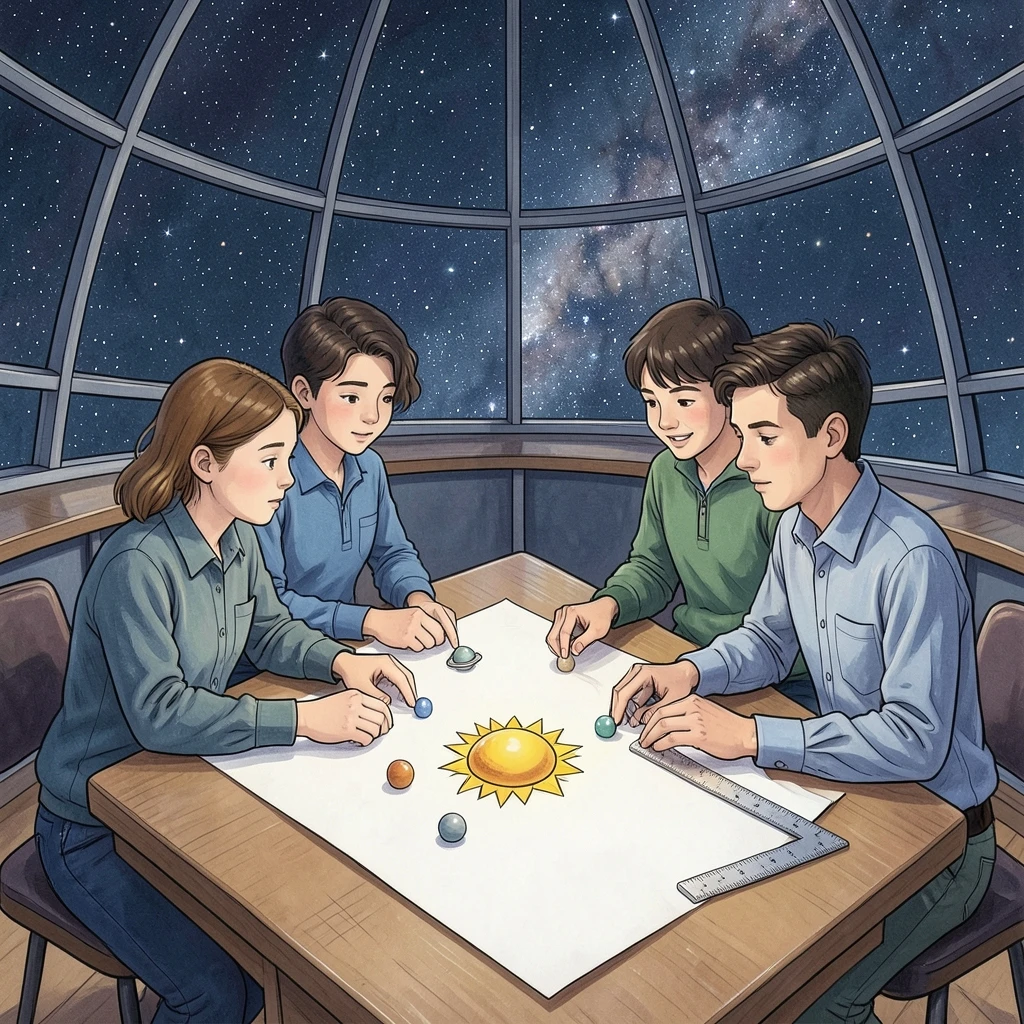
A quick look inside this lesson
What happens in class?
Question to start with
Does this drawing use one scale?
What students actually do
Mark Mars, Jupiter and Neptune on a strip.
Evidence of learning
Evidence-based model critique.
One question from the printable worksheet
A probe planning chart gives Venus 0.7 AU and Saturn 9.6 AU as average Sun distances. Which planet is farther from the Sun?
Lesson plan
Solar System: Planet Distances & Model Limits
A step-by-step guide to help you teach this lesson.
Extra context for teachers
Science notes: Solar System: Planet Distances & Model Limits
A short concept refresher and teaching perspective. The full procedure, printable materials, and student tasks are available in the lesson resources above.
Science in context
Solar-system posters often put planets in neat, nearly equal gaps so every planet will fit on one page. That is useful for recognizing names but not for reading distances. At a scale of 1 astronomical unit (AU) to 1 centimeter, Earth would be about 1 cm from the Sun, Jupiter about 5.2 cm and Neptune about 30.1 cm. The much larger outer gaps are the point of the scale comparison, not a mistake to fix.
A straight distance strip represents approximate average Sun–planet orbital distances. It does not show where planets are on a particular date, the changing separation between Earth and another planet, or their diameters. Asking students to check the scale rule for two data points and name one omitted property turns an attractive diagram into an evidence-based model.
Science reference: NASA — Solar system planet sizes and average distances
What makes the idea observable?
A picture puts eight planets evenly spaced beside the Sun. What might be misleading about the space BETWEEN the planets?
A typical poster is an illustration, not a numerical distance model. Ask what evidence would help.
A misconception worth addressing
- The strip represents average distance from the Sun, not Earth-to-planet distances.
- Planets do not remain lined up.
A practical teaching move
Before placing planet labels, have students calculate where Jupiter and Neptune belong using the same AU-to-centimeter rule. Show an evenly spaced poster beside the strip and ask which one can answer a distance question—and what neither can show.
Verified curriculum references
Plan with confidence
Lesson overview
What students will learn
- Compare average Sun–planet orbital distances using Earth = 1 AU and evidence from a data table.
- Construct or audit a distance-only strip model, keeping its numerical scale consistent.
Key science ideas
- The Sun is the star at the center of our solar system; the planets follow different orbits around it.
- Eight planets in order outward: Mercury, Venus, Earth, Mars, Jupiter, Saturn, Uranus, Neptune.
- Approximate average Sun distances in AU: Mercury 0.4, Venus 0.7, Earth 1, Mars 1.5, Jupiter 5.2, Saturn 9.6, Uranus 19.2, Neptune 30.1.
Lesson at a glance
- Grade 6
- 55 min
- ~10 min prep
- MS-ESS1-3
- 5 materials
What’s included
- Lesson Plan
- Investigation
- Teacher Slides
- Printable Worksheet
- Teacher Answer Key
- Interactive Activity
- Vocabulary